
Appearance
Funnel Analytics
In the Sales Funnels page press Analytics on a funnel to see how it is performing, and to build a shareable link.
Choosing a date range
Press the date range at the top of the page and choose one, such as Today or Last 30 days. You can pick a range of up to 90 days, from any time within the last year.
What the numbers mean
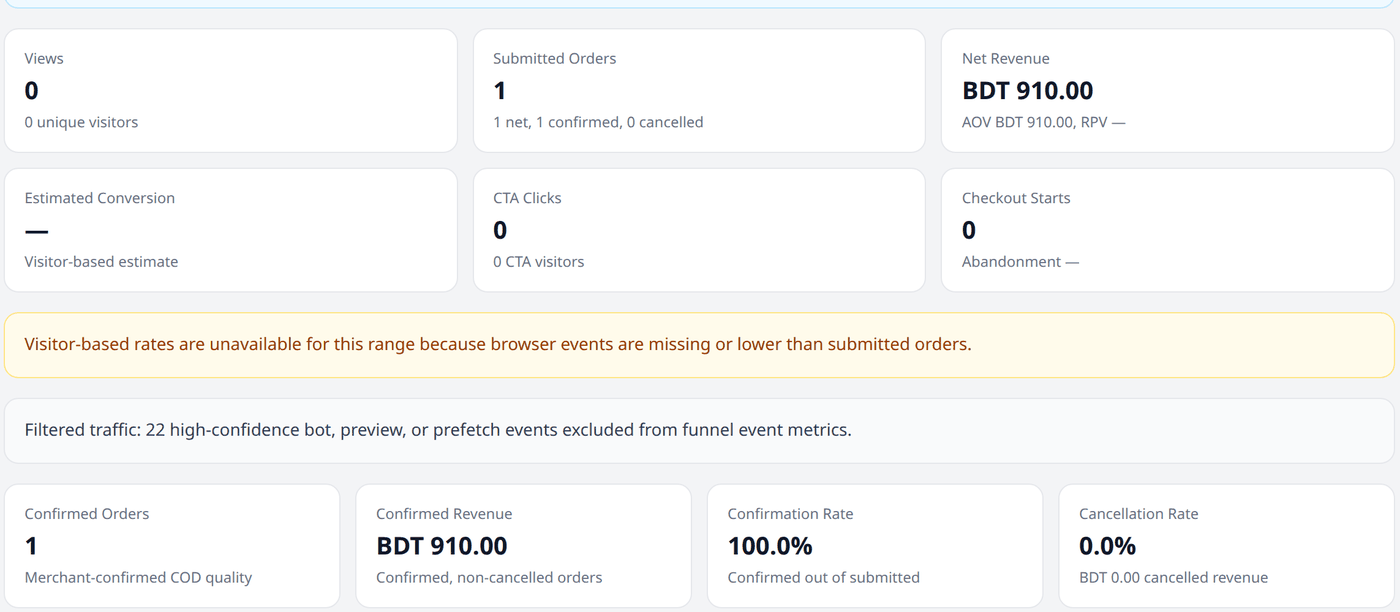
Six cards across the top:
- Views — how many times the page was loaded, with a unique visitor count below.
- Submitted Orders — orders placed from this funnel, counted as net, confirmed, and cancelled.
- Net Revenue — revenue from those orders, plus the average order value and revenue per visitor.
- Estimated Conversion — percentage of visitors who went on to place an order.
- CTA Clicks — how many visitors pressed the buy button.
- Checkout Starts — how many reached checkout, plus the abandonment rate.
Four more cards below, specifically about confirmed orders: Confirmed Orders, Confirmed Revenue, Confirmation Rate, and Cancellation Rate.
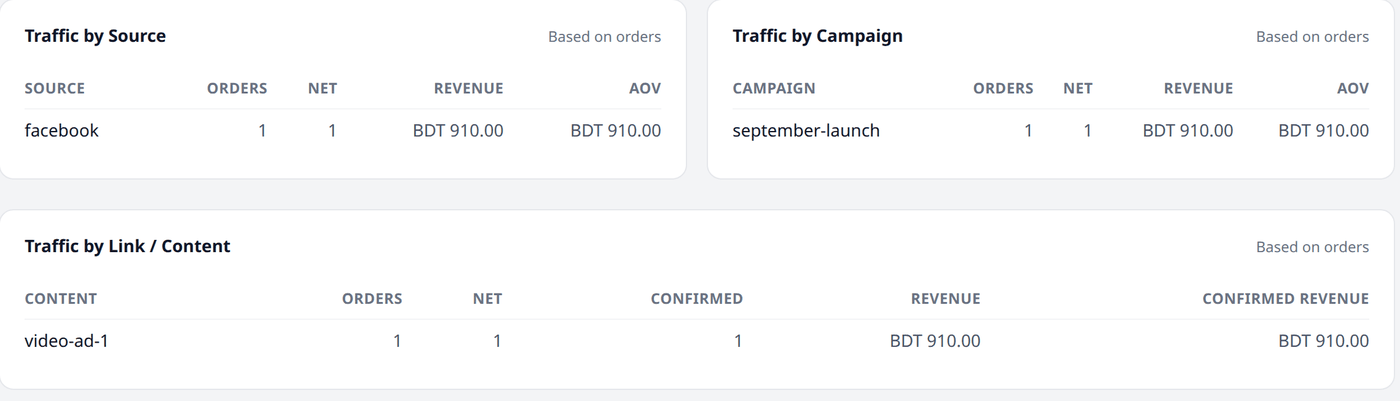
Traffic stats
Three tables break orders down by where they came from — Source (such as Facebook or Google), Campaign (a specific promotion), and Link / Content (a specific ad or link) — each showing its orders, revenue, and average order value. These come from the tags you add when sharing the funnel's link.
Scroll Depth
Scroll depth is how far down the page a shopper scrolled. One bar for each point — 25%, 50%, 75%, and 100% — showing how many visitors reached it.
Sharing a funnel's link
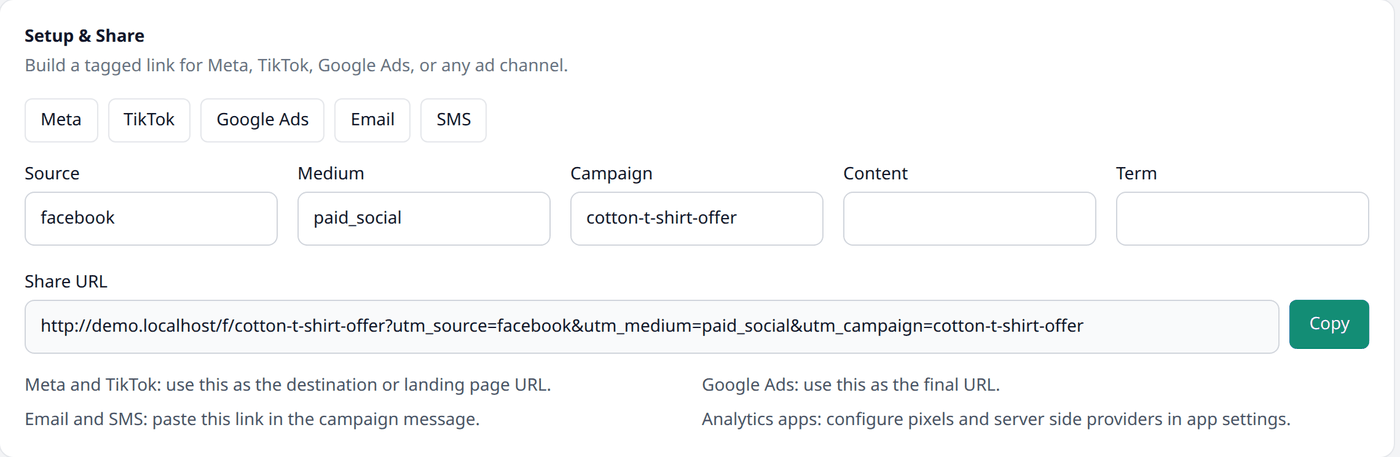
Choose a channel — Meta, TikTok, Google Ads, Email, or SMS — or fill in Source, Medium, Campaign, Content, and Term yourself. Press Copy to get the generated link, ready to paste wherever you are advertising. A funnel is its own page, separate from your storefront. So this link is how shoppers actually reach it.
Recent Orders
Every order placed through this funnel in the chosen date range, with its status, amount, and source.